8 min readUpdated 6 October 2026
The Everfield Analytics page shows four numbers and two charts covering how often your product options were shown to shoppers and how often those shoppers went on to add to cart. This guide explains what each number counts, what it does not count, and which parts of the page are worth trusting. Reading it takes about five minutes and will save you from misreading the figures later.
To open it, go to Apps → Everfield - Product Options and click Analytics in the left nav.
The four numbers on the Analytics page
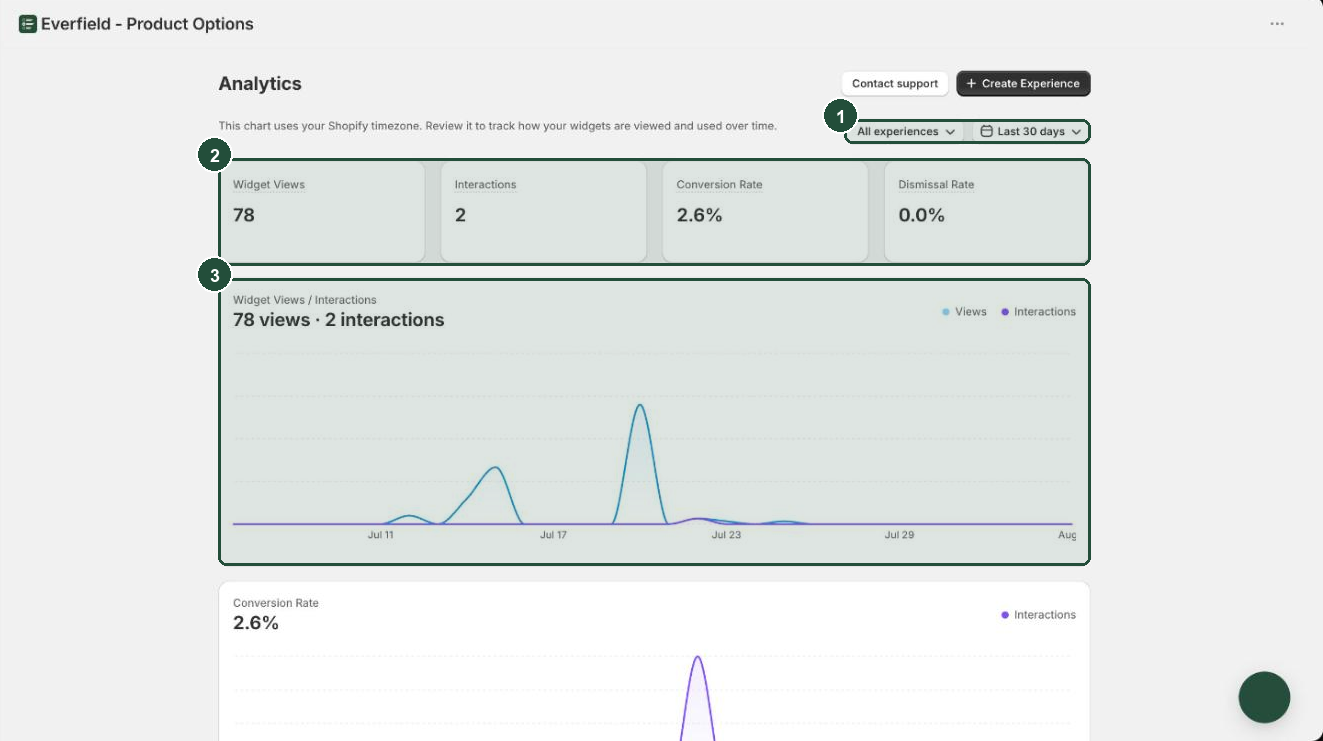
Across the top of the page are four cards:
| Card | What it is |
|---|---|
| Widget Views | How many times an experience was rendered to a shopper. |
| Interactions | How many times a shopper added to cart, or clicked checkout, with your fields present and valid. |
| Conversion Rate | Interactions divided by Widget Views, as a percentage to one decimal place. |
| Dismissal Rate | Always 0.0%. Nothing in the widget can be dismissed. |
All four respond to the date range you pick, and to the experience you pick — the charts underneath do not (see Known limits).
If every number is 0, the most common cause is that no experience has actually rendered on your storefront yet. See Turn on the app embed.
What counts as a Widget View?
A Widget View is recorded each time the widget is rendered to a shopper. One product page load that renders one experience is one view.
Some specifics worth knowing:
- Views are page renders, not people. The same shopper reloading the same product page five times produces five views. Everfield does not de-duplicate by visitor, and does not record who the visitor was.
- Only one experience renders per placement, so a product page records one view. If several published product experiences target the same product, Everfield renders the first one whose targeting matches and stops there — the others render nothing and record nothing. A page that also carries your cart drawer can add one separate cart view on top.
- The cart widget counts once per page. Many themes re-render the cart drawer every time its contents change. Everfield guards against that, so a cart experience records one view per page, not one per re-render.
- A view is counted when the widget renders, not when the shopper scrolls to it. Options below the fold that nobody scrolls to still count.
Widget Views is also the number that counts against your plan's monthly view limit. The usage meter on the dashboard always counts the current calendar month, no matter which date range you have chosen here, so the two figures will rarely match. See Plans and billing.
What counts as an Interaction?
This is the number most people misread, so be precise about it.
An Interaction is recorded when a shopper adds to cart on a product page, or clicks checkout on the cart page, with your fields present and passing validation. It is not recorded when a shopper types in a field, focuses a field, picks a swatch, or opens a dropdown.
The tooltip on the card in the app reads "How many times a customer interacted with a widget field". That wording is misleading. Nothing is recorded until the shopper submits. Read Interactions as "add to cart or checkout attempts with your options attached".
Two consequences follow:
- A shopper who fills in every field and then leaves records nothing. You will see the view, but no interaction.
- Validation has to pass first. If a required field is empty, Everfield blocks the submit and shows the error — and no interaction is recorded for that attempt. Once the shopper fixes it and submits again, that submit counts. One exception: on themes whose add-to-cart popup goes straight to checkout (Dawn-family "notification" carts), a checkout click that Everfield detours to the cart page because required options are missing is recorded as an interaction, even though nothing was submitted.
Because of all this, Conversion Rate is closer to a view-to-add-to-cart rate than a measure of how much shoppers engage with your fields. It is calculated as interactions ÷ views × 100, and it reads 0.0% when views are 0.
Dismissal Rate is always 0.0%. Everfield's widget has no close, hide or dismiss control, so nothing can ever be dismissed and no dismissal is ever recorded. The card exists but the number will not move. There is nothing to fix and nothing to investigate.
Filter by date range and experience
Two dropdowns sit above the numbers.
- Pick a date range. The options are All time, Last 7 days, Last 15 days and Last 30 days. The default is the last 30 days.
- Pick an experience. The first option is All experiences, followed by every experience you have created — drafts and archived ones included, not just published ones. Drafts and archived experiences never reach your storefront, so picking one shows zeros.
The page reloads with the numbers recalculated. Both choices stay in the page URL, so you can bookmark a particular view.
Picking a single experience changes the four cards only. Both charts stay store-wide. That is a known gap in the app, not a bug in your data — see below.
Known limits of these numbers
Be aware of these before you make decisions on the figures.
- The experience filter does not affect the charts. Everfield has no per-experience daily breakdown, so choosing one experience recalculates the four cards while both charts continue to show your whole store. If you want a single experience's trend over time, compare the card totals across two date ranges instead.
- The second chart card is headed Conversion Rate but plots interaction counts. Only the large percentage above that chart is the rate. The line itself is a raw count of interactions per day, not a percentage.
- Daily buckets use UTC dates, not your store's timezone. An event at 11pm in a timezone well ahead of or behind UTC can land in the next or previous day's bucket. Daily totals for stores far from UTC are shifted, though the totals across the whole range are still correct. The helper text on the page says the chart uses your Shopify timezone — it does not.
- "All time" starts on 1 January 2020. It is a fixed start date rather than a truly unbounded range. In practice this covers everything your store has recorded.
- Paid options are not counted separately. When Everfield attaches a priced option to the cart — whether that succeeds or fails — no extra interaction is recorded, so priced options do not change Interactions or Conversion Rate. Figures from before 6 October 2026 were corrected on that date. See Charge for options.
- Interactions can be inflated by the popup-checkout detour. On themes whose add-to-cart popup goes straight to checkout, a click that Everfield sends to the cart page because required options look missing — or because its quick cart check failed or timed out — is recorded as an interaction, at most twice per visitor session. A popup checkout that passes the check records nothing.
- Some themes add to cart without recording an interaction. Everfield hooks the add-to-cart form's submit. If your theme adds to cart from a custom button that never fires that submit, the options still attach to the line item but no interaction is counted, so Interactions and Conversion Rate read low.
- An interaction is not a sale. It is an add to cart or a checkout click. Carts get abandoned. For what customers actually submitted on real orders, use Find answers on orders or your Shopify reports.
- There is no breakdown and no export. You cannot split these numbers by product, field, device or country, and there is no CSV download.
Troubleshooting
All four numbers are 0. No experience has rendered on your storefront in the selected range. Check that the app embed is on and saved in your published theme, that at least one experience is published, and that its targeting rules match the pages you are testing. Then widen the date range to All time. See Turn on the app embed and My options aren't showing.
Views are climbing but Interactions stays at 0. Shoppers are seeing your options but not adding to cart, or the add to cart is failing validation. Load the product page yourself, fill in the fields and add to cart — if that records an interaction, your setup is fine and the number is telling you something about your shoppers rather than about the app. If your own test add to cart records nothing while the options still reach the order, your theme is adding to cart without firing the form submit Everfield listens for — the data is safe, only this metric is under-counting.
I picked one experience and the chart didn't change. That is expected. The experience filter changes the four cards only; the charts are always store-wide.
Dismissal Rate is stuck at 0%. It cannot be anything else. There is no dismiss control on the widget, so nothing is ever recorded.
My daily numbers don't match my Shopify reports. Two reasons. Daily buckets here are keyed on UTC dates, so events near midnight can fall on the neighbouring day. And an interaction is an add to cart, not an order — carts that were abandoned still count here and never appear in your sales reports.
Conversion Rate looks impossibly high. On Dawn-family themes with the "notification" cart popup, required-field detours to the cart page count as interactions and can nudge the rate up. Priced options are not a cause — attaching them to the cart records no interaction.